Survey Report on Osaka Bay (Muko River, Yodo River, Yamato River) Estuary Areas
2025.08.01
Purpose
To conduct fixed-point observations centered on the estuary areas of designated rivers, continuously investigating the seabed (water depth) conditions and the relationship between salinity and water temperature. Additionally, to visually confirm the status of surface litter.
To explore the possibility of understanding litter from various perspectives by continuously conducting fixed-point observations from various viewpoints, aiming to visualize the trends of litter flowing from rivers to the sea and the seabed accumulation status.
Conducted 3-4 times per year.
This is a preparatory stage for fixed-point observations, exploring how data should be continuously acquired.
Hypothesis
The survey will continue based on various hypotheses, such as whether the accumulation status can be observed from changes in seabed topography over time, and whether the relationship between surface salinity and water temperature can lead to determining the outflow routes of underwater litter from rivers to the sea.
Survey
October 16, 2024 (Tuesday): FURUNO Research Vessel PEGASUS
Location:Muko River estuary, Yodo River estuary, reclaimed land, Ichimonji
Survey content:Fish finder data
Precipitation:0mm (Japan Meteorological Agency)
April 18, 2025 (Friday): FURUNO Research Vessel Furuno-maru
Location:Muko River estuary, Yodo River estuary, Yamato River estuary, reclaimed land, Ichimonji
Survey content:Fish finder data, CTD
Precipitation:0mm (Japan Meteorological Agency)
July 17, 2025 (Thursday): FURUNO Research Vessel PEGASUS
Location:Muko River estuary, Yodo River estuary, Yamato River estuary, reclaimed land, Ichimonji
Survey content:Fish finder data, CTD
Precipitation:58.5mm (Maximum 1-hour rainfall: 23.5mm, Maximum 10-hour rainfall: 17.0mm, Japan Meteorological Agency)
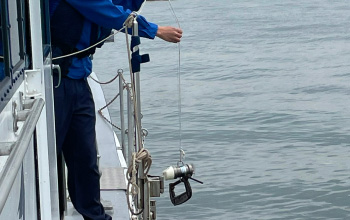
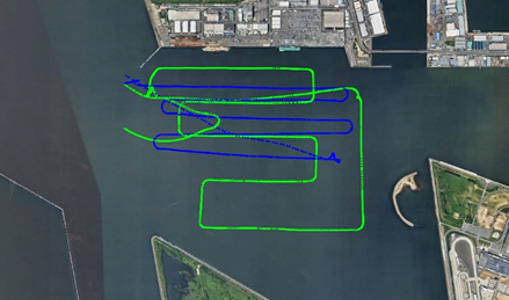
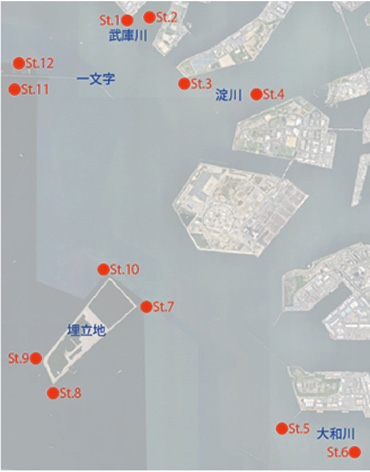
CTD survey at observation points
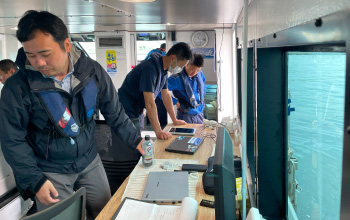
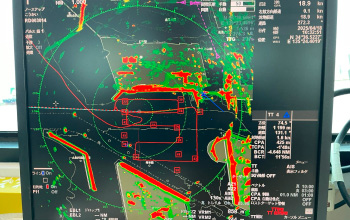
Data confirmation inside the research vessel
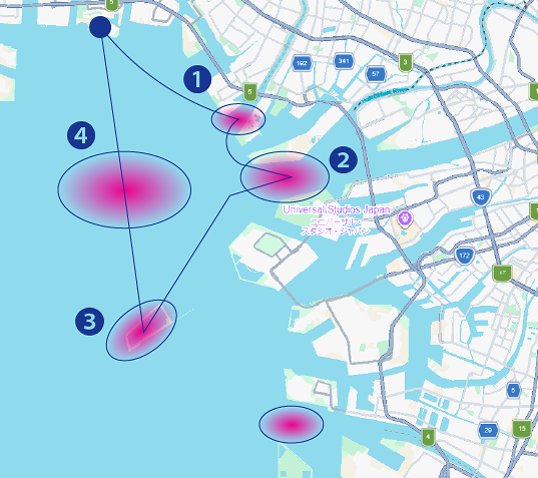
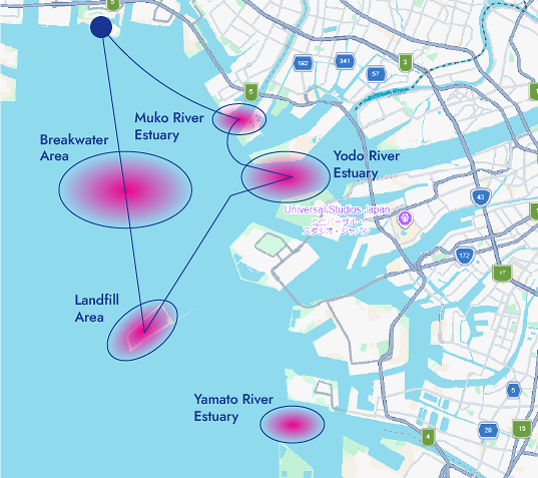
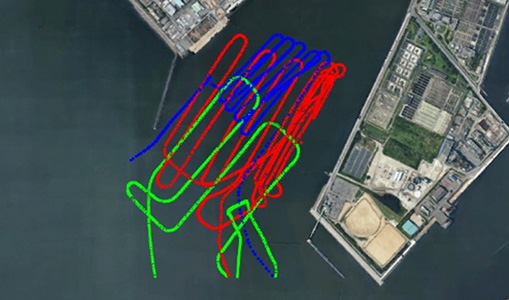
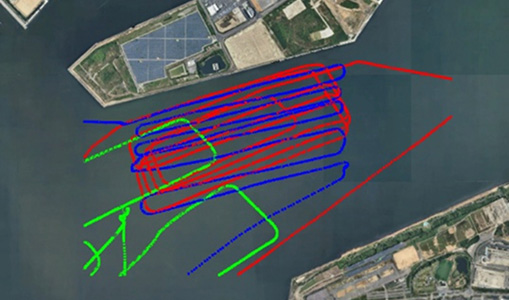
Plotter (navigation system) with CTD deployment positions and routes set
How to Read the Data
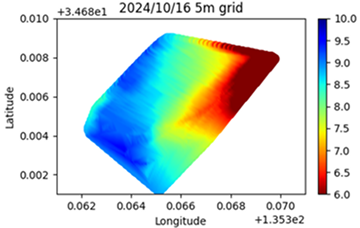
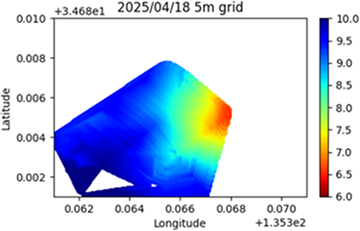
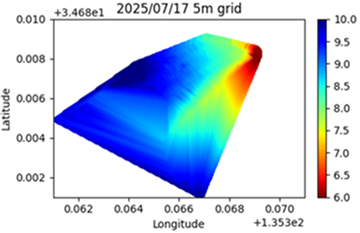
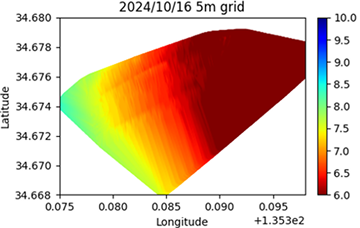
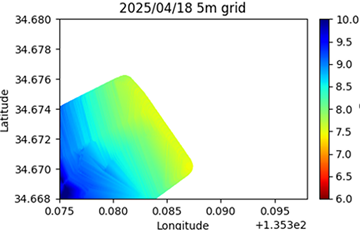
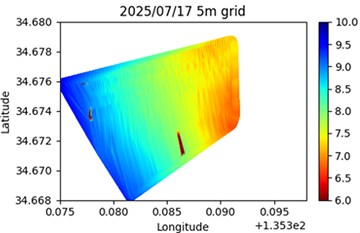
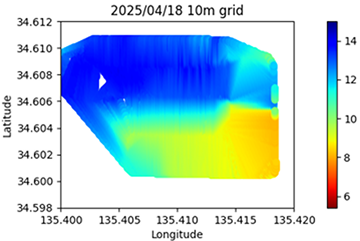
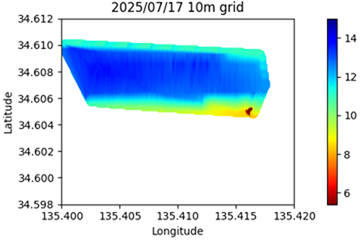
Water depth: Water depth obtained along the track with a fish finder, expanded to a plane by interpolation, and color-coded according to depth (blue: deep, red: shallow).
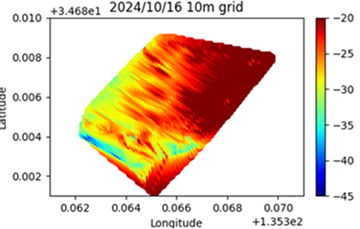
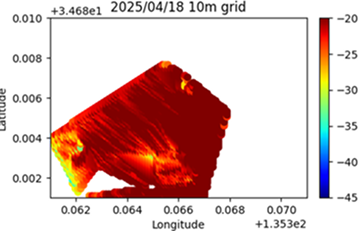
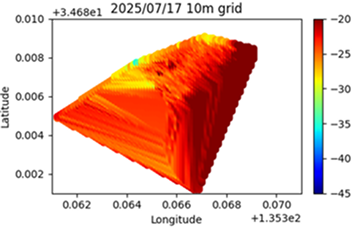
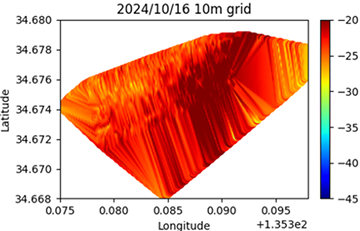
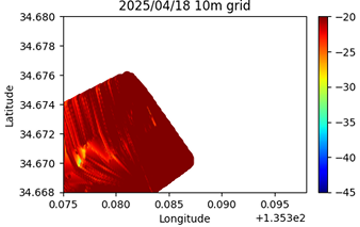
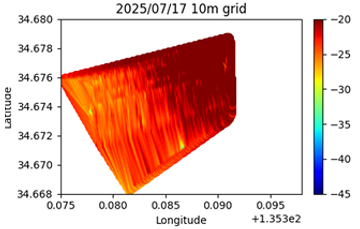
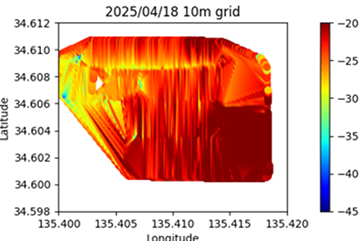
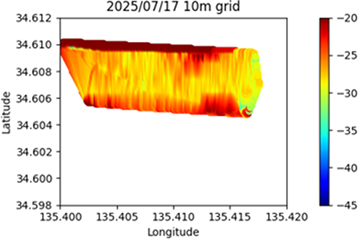
SS: Surface backscattering strength, which correlates with bottom sediment type. Red areas with strong response intensity are considered to have relatively harder bottom sediment. Similarly, SS obtained along the track is expanded to a plane by interpolation and color-coded.
*The above data is estimated from detection along the track in each area and includes errors from interpolation calculations.
Muko River Estuary (Hyogo Prefecture)
●October 16, 2024
●April 18, 2025
●July 17, 2025
Water Depth
●October 16, 2024
●April 18, 2025
●July 17, 2025
SS(Surface backscattering strength)
●April 18, 2025
●April 18, 2025
●April 18, 2025
Yodo River Estuary (Osaka Prefecture)
●October 16, 2024
●April 18, 2025
●July 17, 2025
Water Depth
●October 16, 2024
●April 18, 2025
●July 17, 2025
SS(Surface backscattering strength)
●October 16, 2024
●April 18, 2025
●July 17, 2025
Yamato River Estuary (Osaka Prefecture)
●April 18, 2025
●July 17, 2025
Water Depth
●April 18, 2025
●July 17, 2025
SS(Surface backscattering strength)
●April 18, 2025
●July 17, 2025
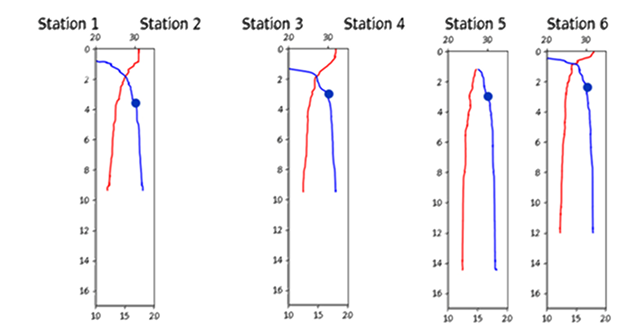
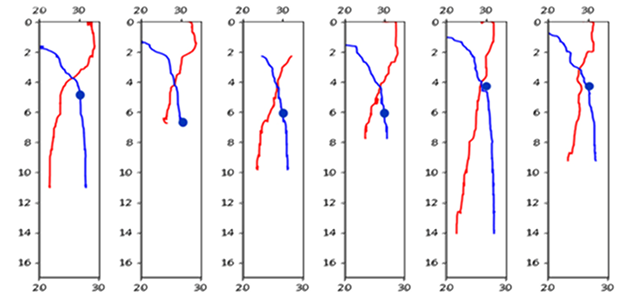
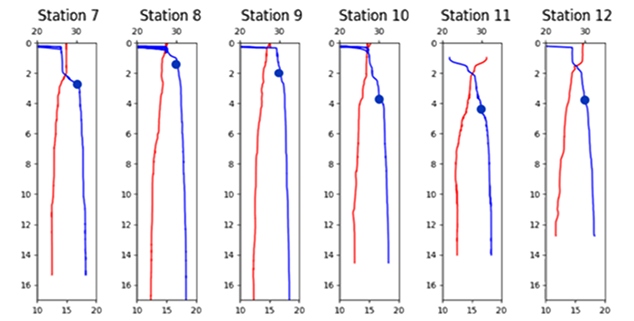
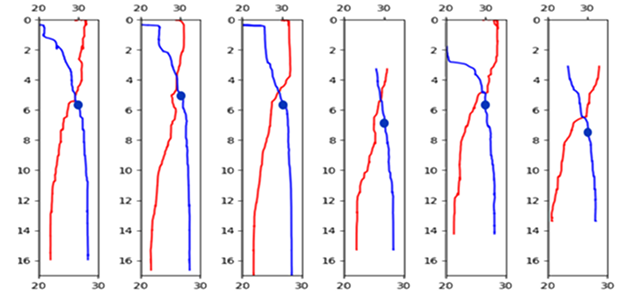
CTD Observations at Measurement Points (Water Temperature and Salinity)
How to Read the Data
Each measurement point (Station) is shown with ● on the map (photo on the left)
The red line on the graph shows the water temperature transition at each depth (scale at the bottom of the horizontal axis)
The blue line on the graph shows the salinity transition at each depth (scale at the top of the horizontal axis)
For salinity, ● is marked at 30 as a guideline for the boundary between freshwater and seawater
The area where seawater and freshwater meet in Osaka Bay is assumed to be 30. The deeper the 30 mark, the deeper the freshwater zone, which may be influenced by rain or water from rivers.
April 18, Precipitation: 0mm
July 17, Precipitation: 58.5mm
April 18, Precipitation: 0mm
July 17, Precipitation: 58.5mm
For Future Evaluation
Continue the above fixed-point observations while considering additional survey items to achieve better understanding of the situation
① Underwater camera: Verification of acoustic evaluation
② 360-degree camera: Understanding the status of surface litter during evaluation
The survey will continue based on various hypotheses, such as whether the accumulation status can be observed from changes in seabed topography over time, and whether the relationship between surface salinity and water temperature can lead to determining the outflow routes of underwater litter from rivers to the sea.